
Published 19 June 2026

Estimated reading time: 10 minutes
Table of contents
- First, What Is the MSCI World ETF?
- What Has It Actually Returned?
- Is the MSCI World ETF Diverse Enough?
- How Diverse It Actually Is
- How Risky Is It?
- How Are Your Rands Affected By The MSCI World ETF?
- The MSCI World ETF Has Very Low Fees!
- So, Is the MSCI World ETF a Good Buy?
- The Number That Changes Everything
Everyone calls the MSCI World ETF the safe one. The grown-up ETF. The diversified one you buy when you have calmed down from chasing Nasdaq returns. Then you open the fact sheet and find out that 72% of this “world” is one country: The US. I used to recommend it as the responsible choice without checking that number myself, which is exactly the kind of mistake my TFSA ebook was written to stop you from making. So before you put a single rand of your R46 000 annual TFSA limit into it, let me show you what you are actually buying.
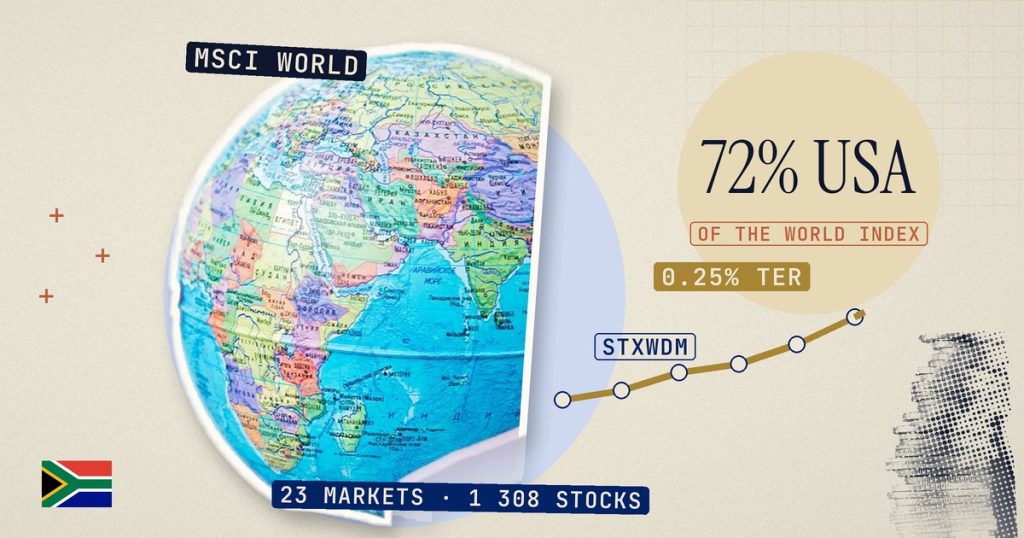
Short answer: the Satrix MSCI World ETF (STXWDM) is the most diversified single ETF a beginner in Azania can buy on one screen; it now costs just 0.25% a year, and it has returned about 15.19% annually since 2017, as of 30 April 2026, according to the STXWDM MDD. But it is not really a bet on the whole world. It is a 72% bet on America with a smoother ride than the Nasdaq.
First, What Is the MSCI World ETF?
The MSCI World ETF is an index of 1,308 large and mid-sized companies spread across 23 developed-market countries. Think the United States, Japan, the United Kingdom, Canada, France, Germany, Switzerland, Australia, and 15 others. It catches roughly 85% of the investable stock market in each of those countries. When someone in Azania says they “buy the MSCI World”, they almost always mean the Satrix MSCI World Feeder ETF.
The Satrix product does not go and buy 1,308 shares itself. It takes your rands and feeds them into a giant offshore fund (currently the Amundi Core MSCI World UCITS ETF Acc), which does the actual share-buying in dollars, euros, yen, and pounds. This is why it’s called a Feeder ETF. Behind it sits the whole developed world. If feeder funds and the basic mechanics of an ETF are still fuzzy, I broke the whole thing down in my beginner ETF guide.
One number worth keeping in your head: this fund holds R24.4 billion. It is one of the most widely held global ETFs in Azania, not some thin, risky product that might shut down next year.
What Has It Actually Returned?
Let me show you the real numbers, pulled straight from the Satrix MSCI World ETF fund fact sheet dated 30 April 2026:
| Period | Fund (annualised) | Benchmark |
|---|---|---|
| 1 year | 15.74% | 15.92% |
| 3 years | 15.99% | 16.13% |
| 5 years | 14.37% | 14.47% |
| Since inception (Jul 2017) | 15.19% | 15.25% |
Since the Satrix feeder launched in July 2017, it has compounded at 14.45% a year in rands. Its best rolling year was 22.92%. Its worst rolling year was a positive 5.24%, which means that on a 12-month basis, it has never actually lost you money since launch.
Now here is the part I refuse to hide from you, because the 5.24% figure is misleading on its own. The Satrix feeder is young. It launched in 2017, so it has never lived through a proper crash. The underlying MSCI World index, which goes back to 1986, absolutely has. In 2008, the index fell 40.71% in dollar terms. At its worst point during that crisis, it was down roughly 57% from the top. It dropped again in 2022. So when you see “lowest annual 5.24%”, read it as “this product has been lucky enough to dodge the big one so far”, not “this product cannot crash”. It can. The world has done it before, so beware.
Is the MSCI World ETF Diverse Enough?
On paper, the pitch is gorgeous. One ETF, 1,308 companies, 23 countries, every major sector. The sector spread genuinely is the broadest you will find in a single fund on EasyEquities:
| Sector | Weight |
|---|---|
| Information Technology | 27.47% |
| Financials | 15.94% |
| Industrials | 11.71% |
| Health Care | 8.73% |
| Consumer Discretionary | 9.27% |
| Communication Services | 9.02% |
| Everything else (staples, energy, materials, utilities, property) | ~18% |
Compare that to the Nasdaq 100, which is roughly half technology and barely touches healthcare, energy, or financials. The MSCI World ETF tracks banks, drug companies, oil majors, factories, and supermarkets alongside the tech giants. If technology has a terrible year, the MSCI World ETF has other engines. The Nasdaq does not. That is real diversification, and it is the honest reason this ETF earns its “balanced” reputation.
How Diverse It Actually Is
You know that “assorted nuts” tub at Woolworths? The one you grab because mixed feels healthier than a packet of one thing? Turn it over and read the breakdown. It is 72% peanuts. The cashews and almonds you actually wanted are a thin layer on top. The MSCI World ETF is like that tub. It calls itself “World”, but the country breakdown as of April 2026 tells you the truth (As of June 2026, the latest MDD on the Satrix website is of April 2026):
| Country | Weight |
|---|---|
| United States | 72.45% |
| Japan | 5.71% |
| United Kingdom | 3.50% |
| Canada | 3.38% |
| France | 2.39% |
| Other 18 countries combined | 12.57% |
The top holdings are: Nvidia at 5.54%, Apple at 4.55%, Microsoft at 3.29%, Amazon at 2.91%, then Alphabet, Broadcom, Meta, and Tesla. The top 10 companies account for about 25% of the fund. Notice anything? Those are the same names that dominate the Nasdaq 100 and the S&P 500.
I can hear you saying: “But Sphiwe, I hold the MSCI World AND the Nasdaq AND the S&P 500 so I’m super diversified.” No, you are not. You are buying Nvidia and Apple three times and feeling clever about it. That is the single most common portfolio mistake I see, and it is worth saying out loud before you split your TFSA across three ETFs that own the same eight companies. The Nasdaq 100 is the high-octane version of this same American tech bet.
How Risky Is It?
Because it spreads across more sectors and a handful of other countries, the MSCI World ETF tends to fall less hard than a pure tech index when the market turns. When the Nasdaq is down 30%, the MSCI World is usually down something gentler, because the banks, healthcare, and consumer-staples holdings it tracks do not crash in at the same time as the chip makers like NVIDIA. That is the whole point of the broader spread.
But “gentler” is relative. This is still a 100% equity fund. Satrix classifies it as aggressive, high-risk, for a reason. If America catches a cold, this fund sneezes, because America is three-quarters of it. A 2008 repeat would take this thing down 30 to 40% in a year, in my not-so-expert opinion. The smoother ride is a real feature. Just do not mistake it for a guarantee.
How Are Your Rands Affected By The MSCI World ETF?
Here is the thing unique to us as Azanian investors: STXWDM is a feeder, so you buy in rands while the underlying companies earn in dollars, euros, and yen. Your actual rand return is two things stitched together: how the world’s stocks did, and what the rand did against those currencies.
Let me make it concrete. Say the MSCI World ETF gains 10% in dollar terms. If the rand weakens 5% against the dollar over the same year, your rand return is closer to 15%. The currency move pushed your return up. Flip it: if the rand strengthens 10% in a year, the MSCI World ETF gains 15%, your rand return shrinks to roughly 5%. Same ETF, very different outcome on your statement.
For most of the last two decades, the rand has weakened over the long run, which has quietly boosted rand returns on global ETFs like this one. That is not promised to continue. If you want to see what any of these returns are really worth once you strip out rising prices, run them through my inflation calculator before you get too excited about a big rand number.
The MSCI World ETF Has Very Low Fees!
Good news that flew under the radar: Satrix cut the MSCI World ETF’s total expense ratio to 0.25% a year, down from about 0.34%. The all-in total investment charge sits near 0.38% once you add platform trading costs.
That 0.25% means that for every R100 000 you hold in this fund, you pay R250 a year in fund fees. Not R3 000 like some Linked Investment Service Provider balanced funds, which charge over ten times more for returns that often lag behind a plain index. Fees do not feel like much in year one. Over 20 years of compounding, they quietly eat a frightening share of your final pot, which is exactly why I wrote a whole breakdown on how investment fees destroy your returns. A 0.25% fund is one of the cheapest legitimate ways to own the developed world.
So, Is the MSCI World ETF a Good Buy?
I am not a financial advisor, so I cannot tell you yes or no, because that would be financial advice. What I am allowed to do is tell you exactly how I treat it in my own TFSA and let you draw your own line.
I hold the MSCI World ETF, and it is currently about 40% of my TFSA, sitting alongside the other ETFs. But your situation is not my situation. Here is the honest way to think about it:
| If you are this kind of investor | How the MSCI World fits |
|---|---|
| You want ONE ETF and never want to think about it again | This is arguably the single best one-fund choice for your TFSA. Broadest spread, lowest fuss, 0.25% fee. Many people run their entire TFSA in just this. |
| You already hold the S&P 500 or the Nasdaq 100 | Be careful. You are adding a fund that is mostly the same US giants. The extra diversification is thinner than it looks. |
| You are nervous about volatility but still want growth | It is the gentler global equity ride. Still 100% shares, still aggressive, but smoother than the tech-only indices. |
If you are still working out whether the MSCI World even belongs in a TFSA versus somewhere else, read how a TFSA actually works first, because the wrapper is doing more for you than the ETF choice. Speaking of which.
The Number That Changes Everything
Here is the calculation I want to leave you with, shown with the working, because this is where the TFSA wrapper does its quiet violence to Uncle Rama’s tax take.
Your TFSA has a R500 000 lifetime contribution limit. At R46 000 a year, you hit that cap in about 11 years (R500 000 divided by R46 000). After that, you cannot add another rand. The money just compounds on its own. Here is what a looks like at a range of returns will look like:
| Annual return | When the cap is hit (~11yrs) | At 20 years |
|---|---|---|
| 8% | R793 377 | R 2 181 161 |
| 10% | R890 831 | R2 753 325 |
| 12% | R1 001 297 | R3 492 973 |
| 15% | R1 195 123 | R5 028 205 |
Total contributions in every single row: R500 000. Everything above that line is compounding, not your money going in. Past performance does not promise the future, and these figures ignore inflation, so check the real-terms version on the TFSA calculator.
In a normal taxable account, those gains get hit by capital gains tax: SARS includes 40% of your gain in your taxable income, which is then taxed at your marginal rate. At the top bracket, that works out to an effective 18% on the gain, and that 18% is the ceiling, not a flat rate everyone pays. On top of that, dividends normally attract a 20% dividend tax. Inside a TFSA, both of those are zero.
The real risk is not the tax. It is you. The index might deliver 8% instead of 14%, or drop 35% in year three and tempt you to sell at the bottom. No calculator can control for whether you hold on. That is the actual variable.
Disclaimer: I am not a financial advisor. This article is for educational purposes only and should not be taken as personal financial advice.