
Last updated 3 September 2026

Let’s say your TFSA has 3 ETFs inside, namely the Nasdaq 100, MSCI World, and S&P 500. How diversified do you think you are? The top 10 all look the same, which might make you think it’s the same ETF if you read the fund fact sheet in a hurry. That is ETF overlap, and it is the most common mistake I see in the TFSA screenshots people send me, the ones where someone is proud of how “spread out” their portfolio looks.
My TFSA ebook breaks down exactly what is sitting inside every major ETF available to you in Azania, holding by holding, so you are never buying blind again. There are 141 ETFs listed on the JSE as of July 2026, with combined assets exceeding R262 billion, a number that climbs every time a new fund lists. More choice, more marketing, and more ways to convince yourself you are diversified when you have actually bought the same handful of companies three times over, and paid three separate management fees to do it.
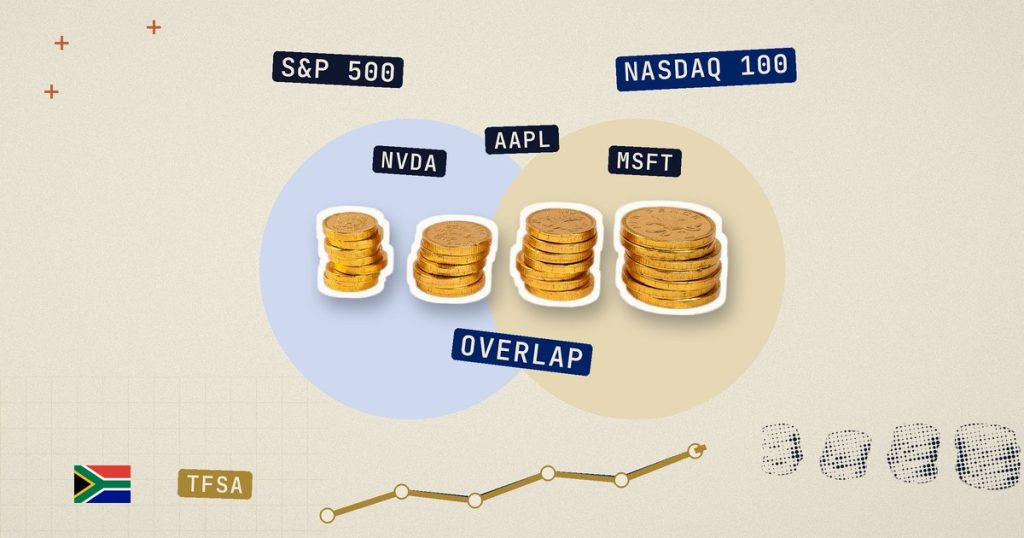
What ETF Overlap Actually Is
In my TFSA ebook, I make an ETF analogy about Choice Assorted Biscuits. An ETF is the box. You buy one box, you get nine different biscuits inside it. That is the whole sales pitch, and it is a good one.
Overlap is what happens when you buy three boxes, thinking you now own 27 biscuits. Every Choice Assorted box ships with the same nine flavours, so you end up with three Romany Creams, three Eet-sum-mors, and three Strawberry Whirls. You paid for three boxes to get nine biscuits, just stacked thicker.
That is what holding the S&P 500, the Nasdaq 100, and the MSCI World at the same time does to a TFSA. The names on the tin are different. Three of the actual biscuits inside are identical, and I am about to show you exactly how thick that stack is.
Same Index, Different Badge
I have seen TFSA screenshots with the Satrix Top 40, the 1nvest Top 40, and the FNB Top 40 sitting in the same portfolio at the same time. Three logos. One index underneath all of them: the JSE Top 40. Same 40 companies. Same weightings, because both Satrix and 1nvest are mandated to replicate the index “as closely as possible,” which means Naspers is roughly 8.71% of your money in both, Gold Fields is roughly 7.81% in both, and so on down the line, verified against the Satrix Top 40 fact sheet.
Here is where it actually costs you something. Satrix Top 40 charges a total expense ratio of 0.10% a year. The 1nvest Top 40 fact sheet charges 0.32%. On a R200 000 balance, that is R200 a year from Satrix versus R640 a year from 1nvest, for the exact same 40 shares in the exact same proportions. Why are you paying triple for the same thing?
I know reading TERs feels like homework. You do not need to memorise every percentage in this section. The one habit worth keeping is: before you buy a second ETF with “Top 40” in its name, check whether it tracks the same index as the one you already own. If the index code matches, you are buying the same biscuits at a worse price, and the investment fees breakdown shows exactly how much that compounds away over 20 years.
S&P 500 + Nasdaq 100 + MSCI World
This is the overlap that actually catches people, because it is not as obvious as three funds with “Top 40” in the name. These are three genuinely different indices, built by different rules, and run by different committees. The S&P 500 is 500 large US companies. The Nasdaq 100 is the 100 biggest non-financial companies on the Nasdaq exchange. The MSCI World is over 1 280 companies across 23 developed countries. On paper, that reads like three separate bets.
Pull up the actual fund fact sheets, though, and here is what each one is holding at the top:
| Company | S&P 500 | Nasdaq 100 | MSCI World |
|---|---|---|---|
| Nvidia | 7.86% | 8.50% | 5.18% |
| Apple | 6.57% | 6.99% | 5.07% |
| Microsoft | 5.34% | 5.75% | 3.66% |
| Amazon | 3.95% | 4.44% | 2.94% |
| Alphabet (A + C) | 5.92% | 6.06% | 4.16% |
| Broadcom | 2.54% | 3.09% | 1.96% |
| Meta | 2.08% | 2.75% | 1.37% |
| Same 7 companies, combined | 34.26% | 37.58% | 24.34% |
Notice the pattern in the table above? The S&P 500’s own top ten only adds Tesla and Berkshire Hathaway to that list. The Nasdaq 100 adds Micron and AMD. The MSCI World, which has to make room for over a thousand other companies, still finds space for JPMorgan in its top ten instead.
Now do the maths on what that means for an actual TFSA. Say you split your contributions evenly, a third into each of the three funds, because that feels balanced. Add up your effective exposure to just those seven companies: (34.26 + 37.58 + 24.34) ÷ 3 = 32.06%. Just under a third of your entire TFSA, sitting in the same seven companies.
But I think we should be fair to the MSCI World here, because it is doing more work than the other two. Its top ten only makes up 24.34% of the fund, against 34.26% for the S&P 500 and a startling 37.58% for the Nasdaq 100. That is because it is genuinely spreading your money across 1 282 companies in 23 countries, not just repackaging the same American mega-caps. Held on its own, the MSCI World is one of the more diversified single-ETF options available to you. The problem only shows up the moment you stack the other two on top of it.
And this is before fees. You are running three separate TERs on largely the same underlying shares: roughly 0.25% for the Satrix S&P 500, around 0.46% for the Satrix Nasdaq 100, and 0.35% for the Satrix MSCI World. Three separate price tags, on what is functionally one very large bet on seven American tech and AI-adjacent companies. (TERs get updated every quarter, so pull the current MDD before you act on the exact number, the direction of the story, though, does not change.)
Where to Go From Here
Knowing that overlap exists is step one. Knowing exactly how much of every JSE-listed ETF is sitting in the same handful of companies is a different job entirely, and it is the one my ebook, You Don’t Know What You Don’t Know: The Complete Guide to Building Your TFSA Portfolio, does for every major ETF available to South African investors, for R199.
If you want to see how the Nasdaq 100 behaves as a standalone holding before deciding whether it earns a place next to your other funds, read our Nasdaq 100 ETF guide for TFSAs. Once you have picked a combination that actually spreads your risk, run it through our TFSA Calculator, or compare shortlisted options in our 5 Best ETFs for Your TFSA guide.
This content is for educational purposes only and does not constitute financial advice. Fund fees, returns and holdings change over time. Always check the current MDD on the provider’s own website before investing, and consult a licensed financial advisor about your specific circumstances.